Share of Search predicts who sells — on Google and TikTok. Here's the proof.
A brand nobody follows is outselling brands with hundreds of times its influence. Here’s what actually predicted it.
For as long as we’ve run creator campaigns, one number has been impossible to tie to the work: which creator, and which piece of content, actually sold your competitor’s product.
Big brands have always been able to buy competitor sales data from the likes of Nielsen and Circana. But that data is expensive, aggregated to brand and channel, weeks behind, and blind to who drove it. It tells you a rival sold X last month. It can’t tell you which video did it.
So the industry measured what it could see. Followers. Engagement. Reach. Vanity - because vanity was the only thing that was public.
TikTok Shop broke that wall.
Sales are now visible in near real time, unit by unit, creator by creator, video by video - for brands you don’t own. Which means, for the first time, we can lay the whole funnel side by side across competitors and see what actually converts.
So we did.
Five lenses on the same brands
We took one category - US skincare - and pulled five independent data sets, calculated in-house, brand by brand, on the same set:
Share of Influence - creator and earned-media strength on Instagram.
Share of TikTok Influence - creator reach and follower base on TikTok.
Share of Search (Google) - real search demand on Google.
Share of Search (TikTok) - real search demand inside TikTok.
Share of Sales - real TikTok Shop revenue, per brand and per creator.
How loved they are on two platforms. How searched they are in two more. And how much they actually sell.
That last column is the breakthrough - not that competitor sales exist, but that they’re now readable creator by creator, in near real time, cheaply enough to line up against everything else. This isn’t a survey or a brand-lift model. These are the receipts.
Three brands, one very strange league table
We stripped the category down to three brands. We’ll keep them anonymous, because the point isn’t who they are - it’s what they prove. Call them the Icon, the Sleeper, and the Hype.
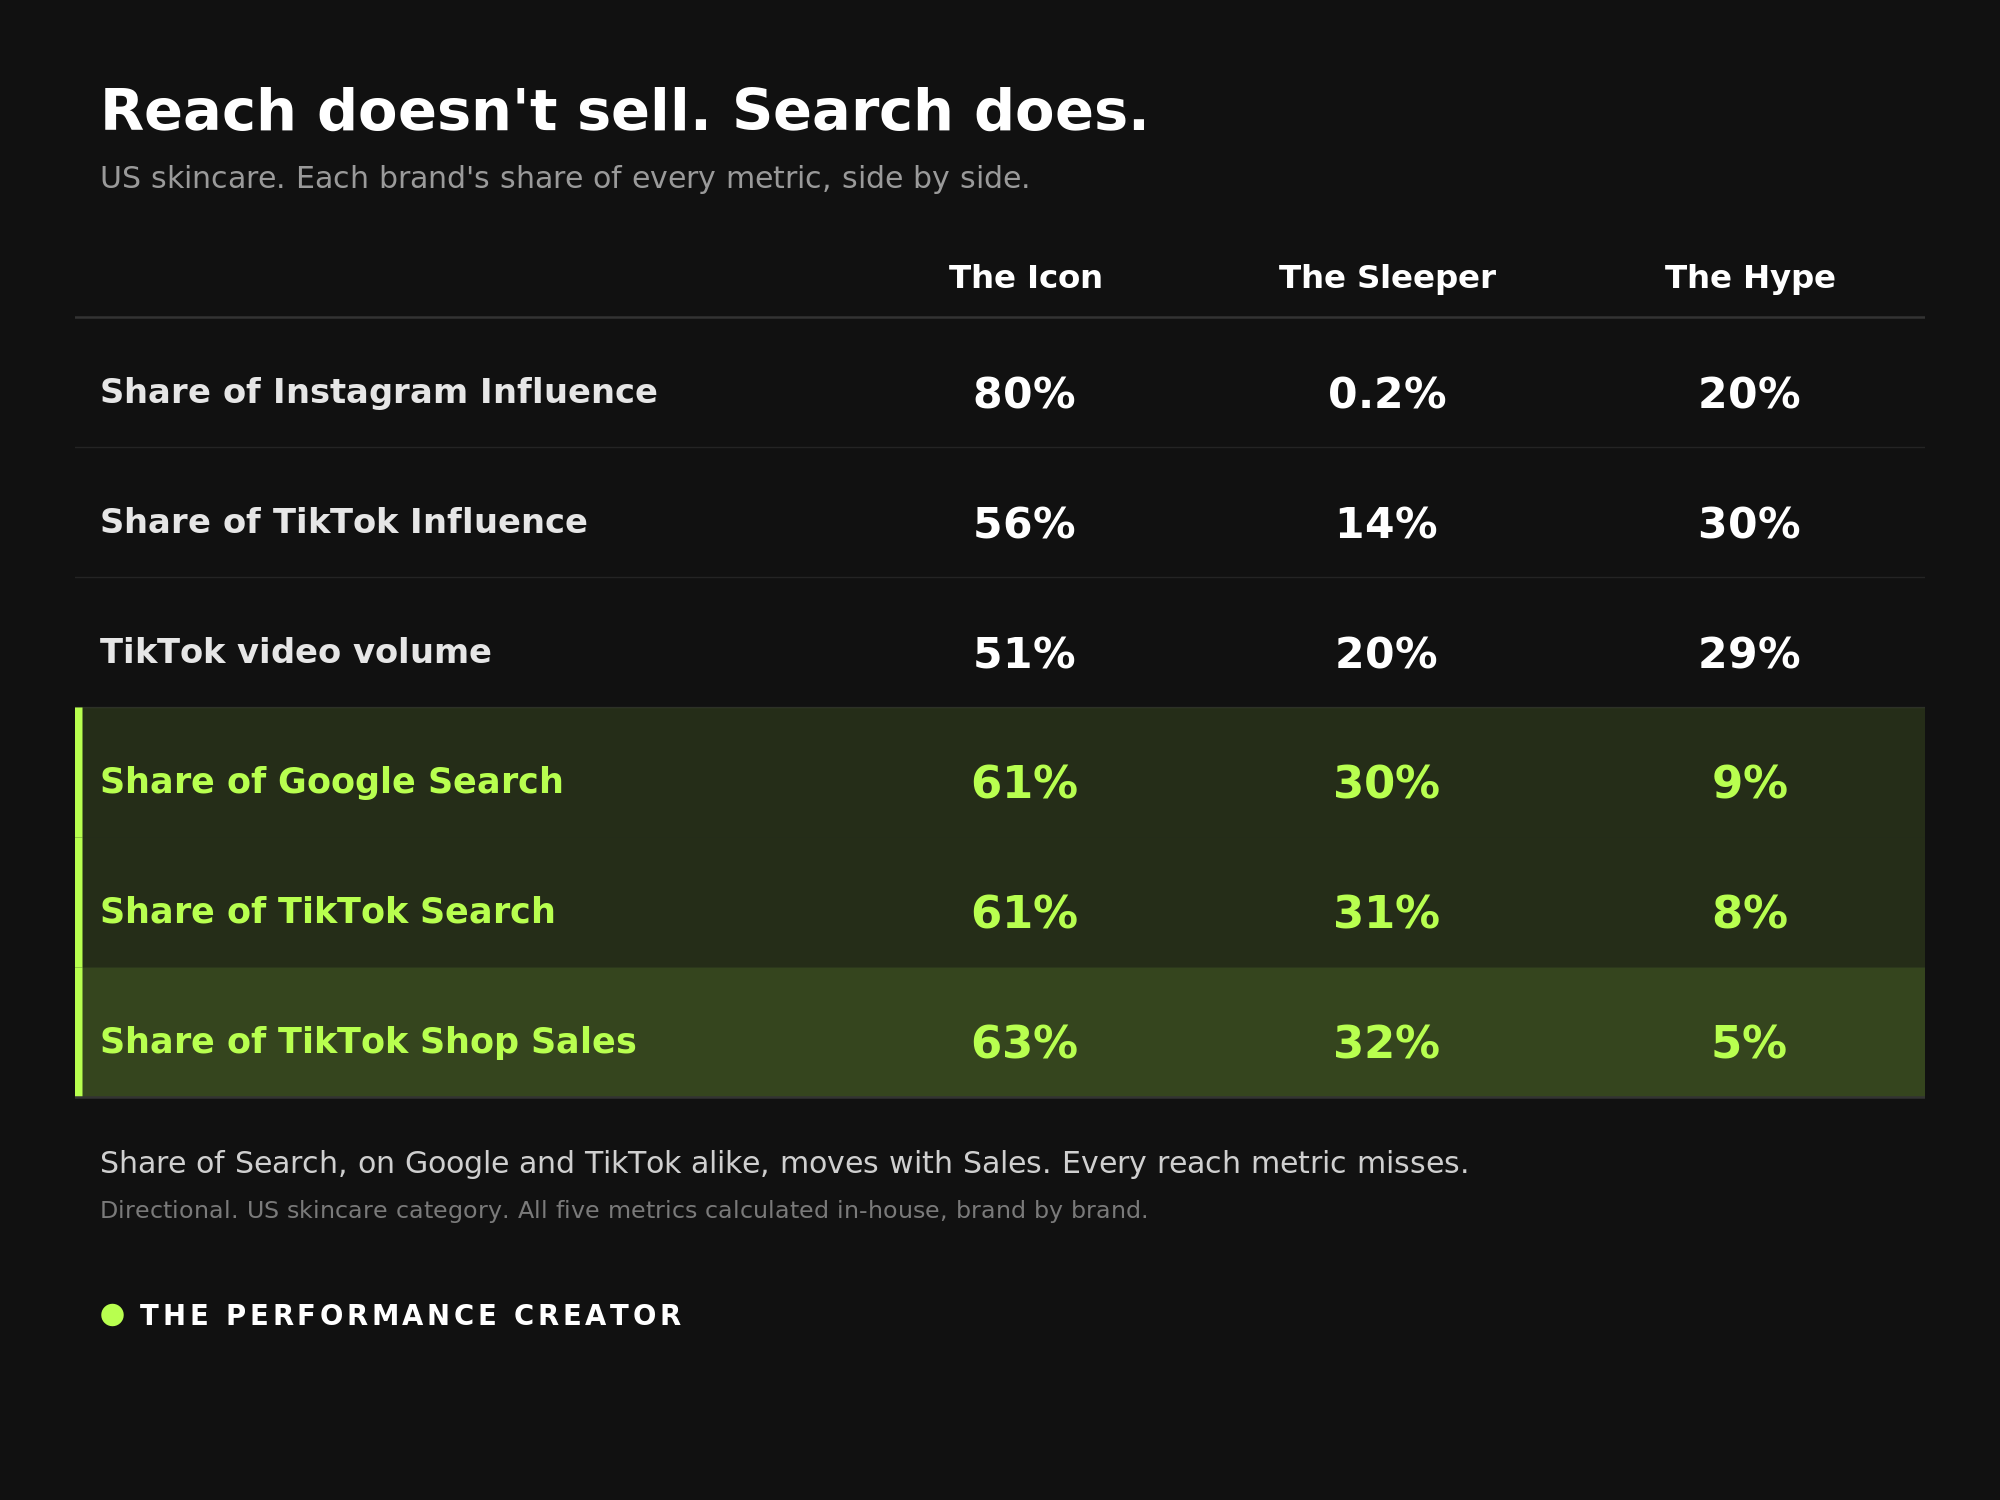
Start with the Sleeper. Almost nobody follows it. On the metric our industry lives on - Instagram influence - it holds about 0.2% of the category. Its main account is so small you’d scroll straight past it. By the number brand teams report, the Sleeper is an also-ran that shouldn’t be in the conversation.
It is the #2 selling brand in the category. Millions in sales, second only to the Icon.
We didn’t believe it either. So we went looking for what was driving it.
It wasn’t reach. On any platform.
It wasn’t Instagram. The Icon wins Instagram influence in a landslide, and it also leads sales - so on the surface, influence “works”. But underneath the leader, the ranking scrambles completely. The Sleeper has almost none and sells second. A third brand has plenty and sells a fraction. Instagram influence did not order the sellers. It never does.
It wasn’t engagement. WPP Media, System1 and TikTok just ran the biggest study on creator effectiveness we’ve seen - 1,217 ads, 8 markets, 183,000 people. Their finding: Engagement Rate explains roughly 0.2% of whether anyone even remembers the brand. Not weak. Effectively nothing.
It wasn’t TikTok fame either - and this surprised us most. The Hype has more TikTok content and more total views than the Sleeper. The Sleeper has the single biggest TikTok following of the three - bigger than the Icon - and it still sells second, not first. Followers, views, reach: none of them put the brands in the order they actually sell.
And it wasn’t the number of creator videos. The Hype pumps out more creator videos than the Sleeper. If volume were the answer, it would be winning. It has the second-highest content output in the set - and the lowest sales.
Every reach metric missed. Instagram, TikTok, followers, views, video count. All of it.
The one thing that lined up: Share of Search. On both engines.
Here’s where the data corrected us. We assumed Google had gone quiet for a brand like the Sleeper. It hasn’t. When we stopped using a quick relative index and measured actual search demand, brand for brand, this came back:
The Icon - Google Share of Search 61% | TikTok Share of Search 61% | Share of TikTok Shop sales 63%
The Sleeper - Google Share of Search 30% | TikTok Share of Search 31% | Share of TikTok Shop sales 32%
The Hype - Google Share of Search 9% | TikTok Share of Search 8% | Share of TikTok Shop sales 5%
Both search columns track sales almost perfectly. Not one or the other. Both.
The Sleeper that nobody follows does roughly 180,000 Google searches and 120,000 TikTok searches every month. Invisible on vanity. Enormous on intent. That is the entire reason it sells second.
One honest number, because it matters: in absolute terms Google is still the bigger engine. The Icon does about 368,000 Google searches a month against 241,000 on TikTok, and the pattern holds down the set. TikTok is not replacing Google. It is the second search engine - growing fast, and sitting inches from the checkout, so the intent it captures converts faster.
The real divide was never a platform
It’s search versus reach. Intent versus vanity.
A follower is a maybe. A view is a glance. A search is a hand in the air.
That’s why every reach metric missed and both search metrics hit. Search is the moment demand becomes a buyer. Reach is the noise the content made on the way past.
Les Binet has said for years that Share of Search leads sales. It does. It just now has two front doors.