Jon Renau influencer marketing case study: This Is My HairThree creators took Jon Renau from page two to page one of Google
Three creators, one identity story, and a full-funnel read from first view to average order value.
Real questions. Real answers. Real proof.
Buyers asked the questions in the comments. Tamsyn, Tasneem and Chantell answered them on camera. This is the whole campaign, and what it moved, in one Reel.
Three creators, one identity story, measured to the checkout
What we did
- Shortlisted 40 South African creators and contracted 3 who live the hair-loss story.
- Ran 47 organic posts through one approval flow, so the client signed off every piece in one place.
- Boosted the best posts from the creators’ own handles on Meta and TikTok, then republished them as shoppable video on wigs.co.za.
What worked
- 1.4M+ true organic views and an 8.86% Meta click-through rate, 4 to 8 times the category norm.
- People went and searched the brand: average Google position moved from 10.6 to 5.8 and “jon renau wigs” clicks rose 275%.
- Orders that touched creator content on site were 28% larger.
What we would change
- Site traffic fell back toward baseline within a month of paid media stopping, so creators stay on 2 to 4 posts a month.
- Only 27% of the catalogue was tagged for shoppable video. The target is 80% or more.
- One creator drove 69% of link clicks. Scale her, and test the US and UK audience already showing up in Search Console.
The posts that did the work
Real posts from the creators’ own accounts, unscripted and approved by the client. Press play to watch them here.

Open on TikTok

Open on Instagram

Open on Instagram

Open on TikTok
What held after the flight, and what didn’t
We report the decline as clearly as the lift. It is the strongest argument for always-on creator activity a client can be given, because it is their own data.
Position 5.8 was earned through awareness, and erodes slowly rather than resetting.
“Jon renau south africa” did not exist as a query before the campaign and continues to draw clicks.
Weekly active users fell toward the 2025 baseline within a month of paid media stopping.
Sauce gallery impressions fell 41.5% and video plays 25.9% once creators went quiet.
What we would do next: Keep creators posting 2 to 4 times a month, run the top creative always-on at reduced budget, tag 80%+ of the catalogue in Sauce, and test the US/UK diaspora audience that Search Console already shows.
A wig brand that people search for, not just scroll past
Jon Renau is a premium US wig and topper brand. In South Africa it is sold through The Hair Club, and the category carries stigma: women wearing wigs for hair loss, alopecia or medical reasons rarely see themselves represented, and rarely say the brand name out loud.
The brief was to make the product visible through real wearers, and to prove the effect beyond views: in search behaviour, on the website, and at the checkout.
- Objective
- Awareness and identity storytelling that converts to site traffic and orders
- Audience
- SA women 25 to 55 living with hair loss; secondary diaspora signal in US and UK
- Creative idea
- “This Is My Hair”: wearers own the wig as their hair, on camera, unscripted
- Success
- Organic reach, boosted-content efficiency, branded search, website users, AOV
What 1.4 million people actually watched
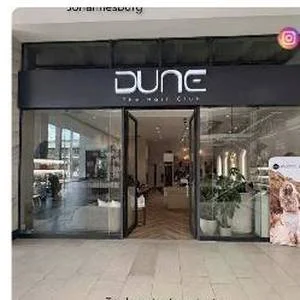
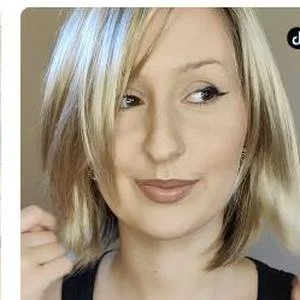
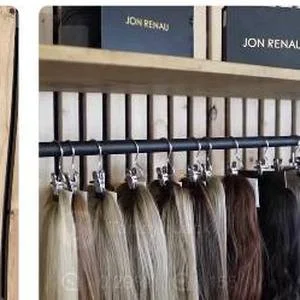
Every organic post from the flight, as tracked in the campaign. Tap any tile to open the original. Tasneem in the Jon Renau boxes and the Dune store, Tamsyn’s wig-flip and champagne shots, Chantell’s blonde bob. None of it was scripted by us, all of it was approved by the client before it went live.
 InstagramChantell1 engagements
 TikTokChantell♥ 72 · 4 comments
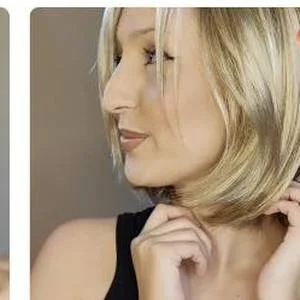 InstagramChantell0.48% ER · 12 engagements
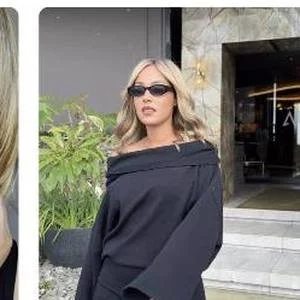 InstagramTasneem1.29% ER · 421 engagements
 InstagramTamsyn533 engagements
 InstagramTasneem1.2% ER · 300 engagements
 TikTokTamsyn♥ 120 · 4 commentsInstagramTamsyn1.96% ER · 582 engagementsTikTokChantell♥ 159 · 8 comments
 InstagramChantell0.53% ER · 10 engagements
 InstagramTamsyn2.5% ER · 543 engagements
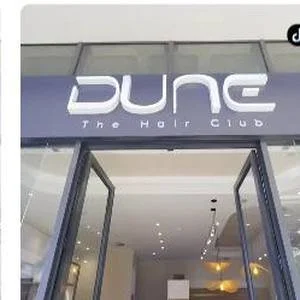 TikTokChantell♥ 106
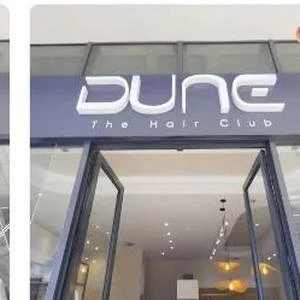 InstagramChantell0.22% ER · 8 engagementsTikTokTasneem♥ 793 · 26 comments
 InstagramTasneem9.31% ER · 484 engagements
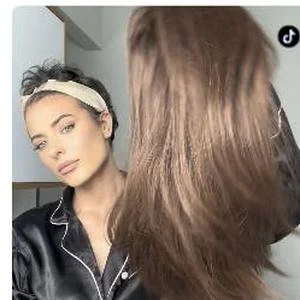 TikTokTamsyn♥ 104 · 3 comments
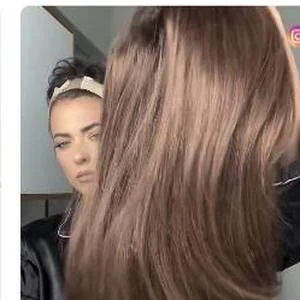 InstagramTamsyn1.85% ER · 418 engagements
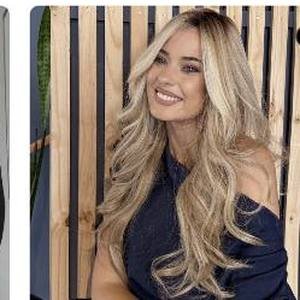 TikTokTamsyn♥ 542 · 12 comments
 InstagramTamsyn0.29% ER · 155 engagementsInstagramTasneem0.7% ER · 748 engagements
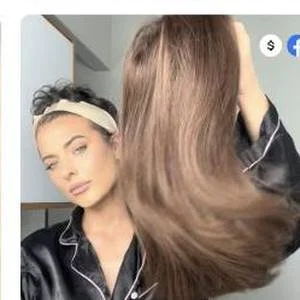
Then the same content, run as ads. The strongest organic posts were boosted from the creators’ own handles on Meta and TikTok: no studio re-shoot, no brand-voice rewrite. The tile with 13.1K link clicks is Tasneem’s Meta ad; the whole paid layer came from creative that had already proven itself organically.
 AdTasneem13.1K link clicks
 AdTamsyn1.09K link clicks
 AdTamsyn314 link clicks
 AdTasneem208 link clicks
 AdTamsyn181 link clicks
The top five ads by link clicks, all boosted from the creators’ own handles.
One ecosystem, five stages, six data sources
Everything below ran inside the Tribeez workspace on Sprout Social Influencer Marketing, with paid, analytics and on-site commerce data joined at reporting. The screens are the live campaign as it sits in the platform today; the content is the creators’ own.
Open any stage for the detail and the live platform screens.
1Identify
Client ask: creator identification
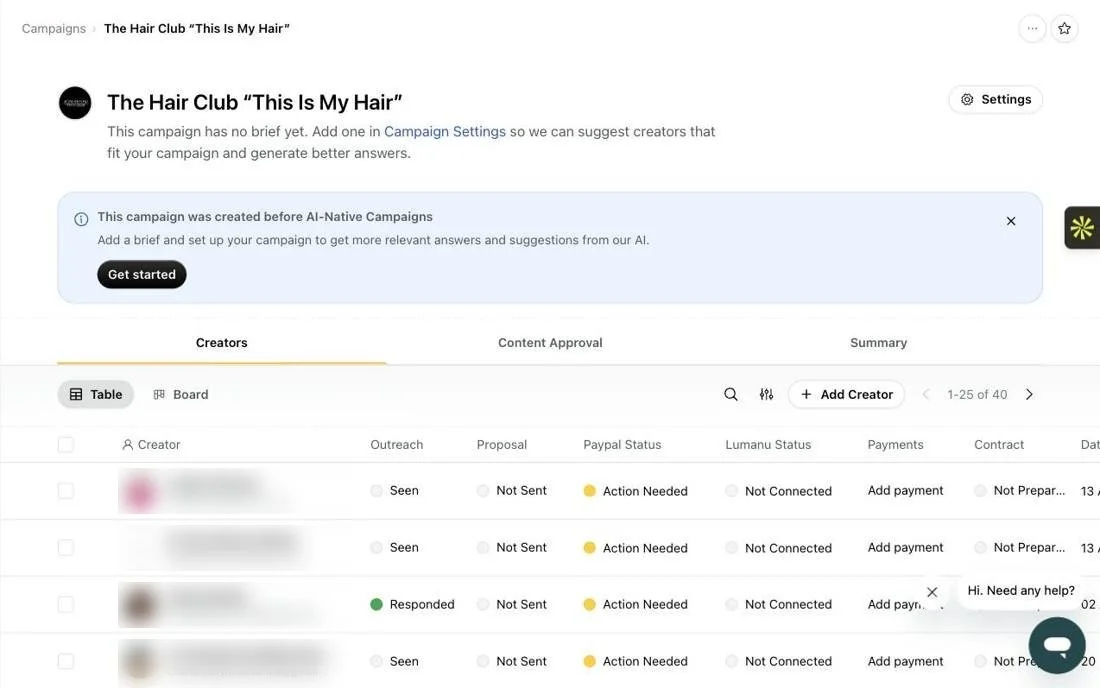
We built a shortlist of 40 South African creators inside the campaign: a deliberate mix of lifestyle and beauty voices, women with visible hair-loss journeys, and credentialed dermatologists and skin specialists who could speak to the medical side of wig wearing. Each was searched, vetted on audience location and authenticity, and added to the pipeline with outreach tracked per person.
Three were contracted for the first flight: Tasneem Morgan, Tamsyn Jack and Chantell Ashleigh Kock. The remaining 37 stay warm in the pipeline for follow-on flights, which is what the “Seen / Responded / Ready for Outreach” statuses record.
2Manage
Client ask: creator management
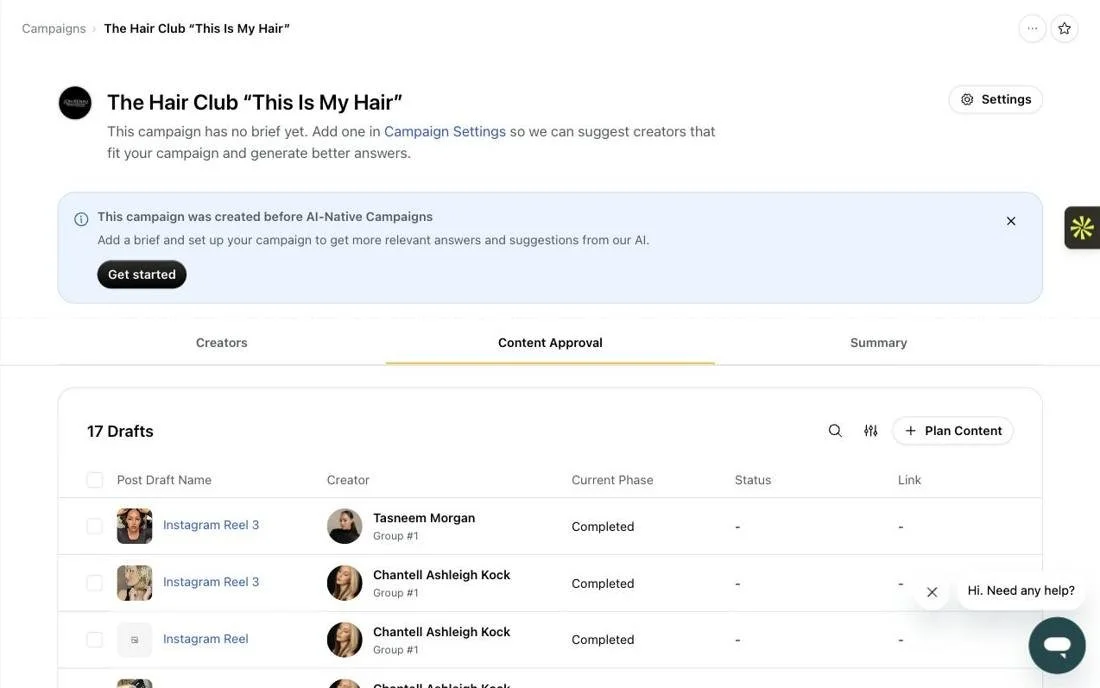
Every deliverable was planned as a dated post draft with a due date, and moved through review phases (creator draft, Tribeez review, client review, completed) before anything went live. Seventeen drafts were run this way across TikTok videos, Instagram Reels, carousels and Stories, so the client could see and approve creative in one place instead of over WhatsApp.
3Content and UGC
Client ask: content / UGC
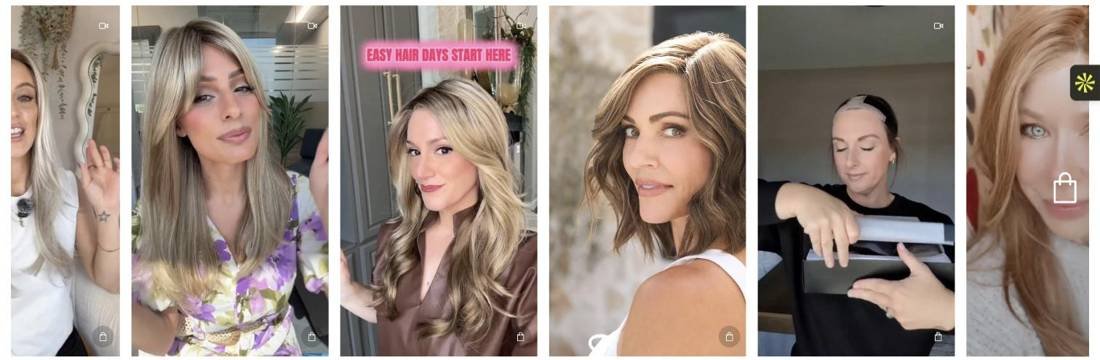
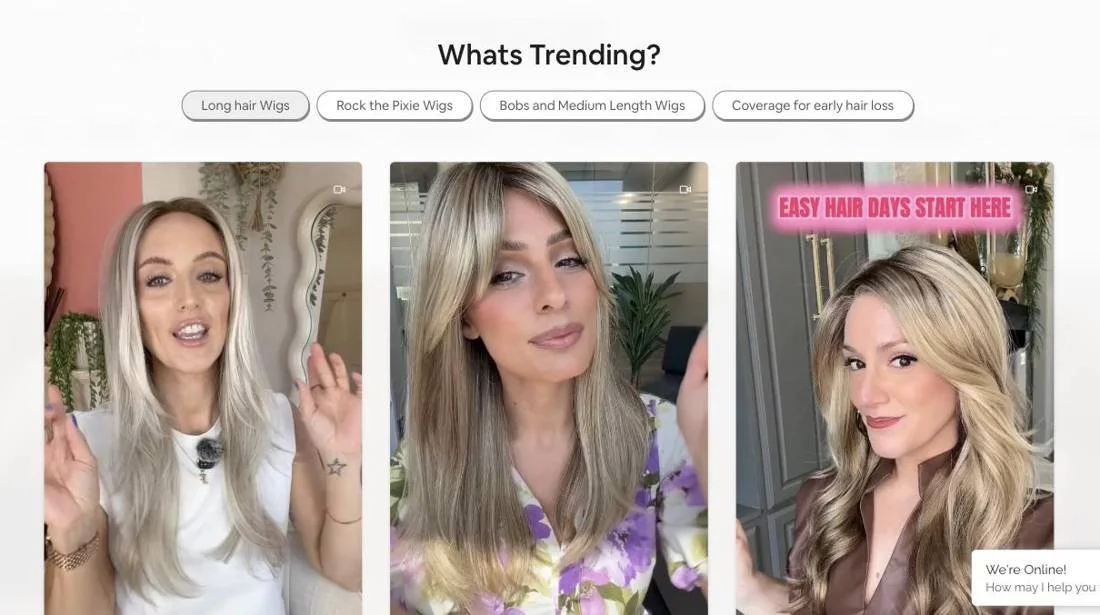
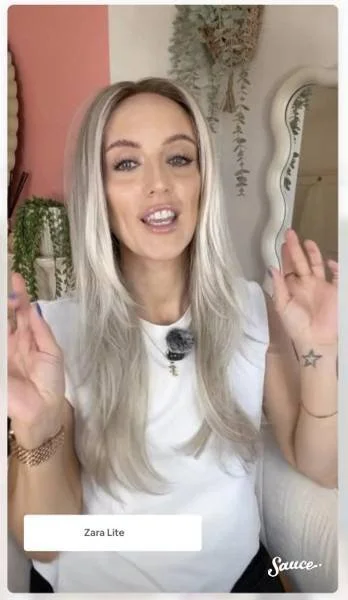
The creators told their own hair stories in first person: a Dune-themed day out in a topper, morning routines, “what people say when they find out”. No scripts, no product-shot mandates. 47 posts went live organically; 52 are now tracked in the platform including boosted variants. The best-performing organic pieces were then licensed as ad creative and republished into Sauce galleries on wigs.co.za, so one piece of content worked three times.
Tasneem Morgan’s 24 posts carried the campaign, with 69% of link clicks and 70% of EMV, which is exactly the kind of read that decides who gets scaled in the next flight.
4Amplify and track
Client ask: performance tracking
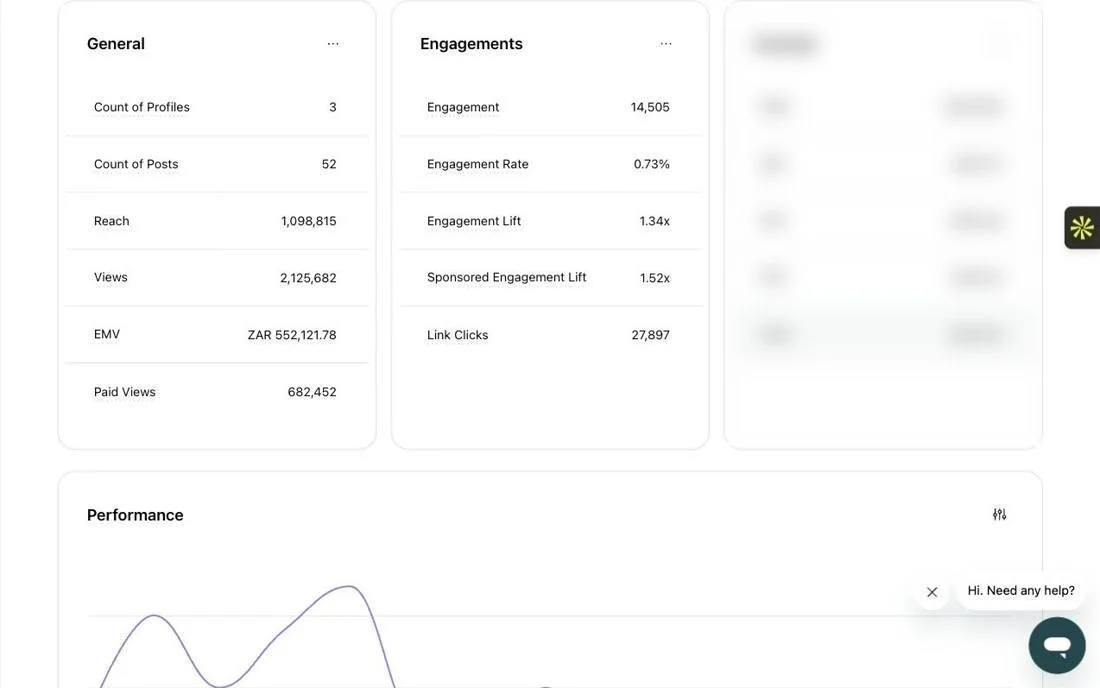
Organic performance was tracked live in the campaign summary: views, reach, engagement lift, link clicks and efficiency metrics per platform, per content type and per creator. The winning posts were then boosted as creator-handle ads on Meta and TikTok, and the paid layer was reported alongside the organic layer rather than instead of it.
5Convert
Client ask: the journey through to conversion
Conversion was read in three places. Google Search Console showed whether watching turned into searching. Google Analytics showed whether searching turned into visiting. Sauce, the shoppable UGC layer embedded on wigs.co.za, showed whether visitors who engaged with creator content bought differently from those who did not.
They did: orders that touched creator content on-site were 28% larger than orders that did not, and Sauce-attributed sales reached 43.4% of site revenue in the peak month with only 27% of the catalogue tagged.
What moved, by stage of the funnel
| Stage | Measure | Before / baseline | Campaign | Change | Source |
|---|---|---|---|---|---|
| Attention | True organic views | n/a | 1,427,223 | Earned | Sprout Social |
| Attention | Meta click-through rate | 1 to 2% norm | 8.86% | 4 to 8× norm | Meta Ads |
| Search | Average Google position | 10.6 | 5.8 | Page 2 → page 1 | Search Console |
| Search | “jon renau wigs” clicks | 55 | 206 | +275% | Search Console |
| Search | “jon renau south africa” clicks | 0 | 144 | New term | Search Console |
| Site | Active users, Jan to Jun | 5,400 | 7,400 | +37% | GA4 |
| Site | Direct traffic sessions | 1,200 | 2,600 | +117% | GA4 |
| Site | Organic search sessions | 4,900 | 6,100 | +24.5% | GA4 |
| Basket | Average order value | Orders without creator content | Orders with creator content | +28% | Sauce |
| Basket | UGC-attributed share of revenue | n/a | 43.4% | Peak month | Sauce |
Year-on-year comparisons are Jan to Jun 2025 vs Jan to Jun 2026. Paid views (682,452) are reported separately and excluded from organic totals.
People watched Tasneem, Tamsyn and Chantell, then went to Google and typed the brand name. That is brand building at its most measurable.
Want a campaign run like this?
The same five stages run every Tribeez influencer campaign: identify, manage, content, amplify and convert. Tell us what you need people to do next.
Sources: Sprout Social Influencer Marketing campaign summary; Meta Ads Manager; TikTok Ads Manager; Google Analytics 4; Google Search Console; Sauce on-site UGC analytics. Campaign period 30 Jan to 31 May 2026; report compiled June 2026. Figures are reported as recorded; where the live platform has since updated (52 posts, R552,122 EMV), the report-date values are used in the narrative.
Tribeez · performance creator marketing · South Africa, Netherlands, Dubai